Well, it looks like it’s hot season in cryptocurrency trading. So, how about a simple tool to keep you updated on price changes from Binance platform and provide some quick statistics?
WHAT
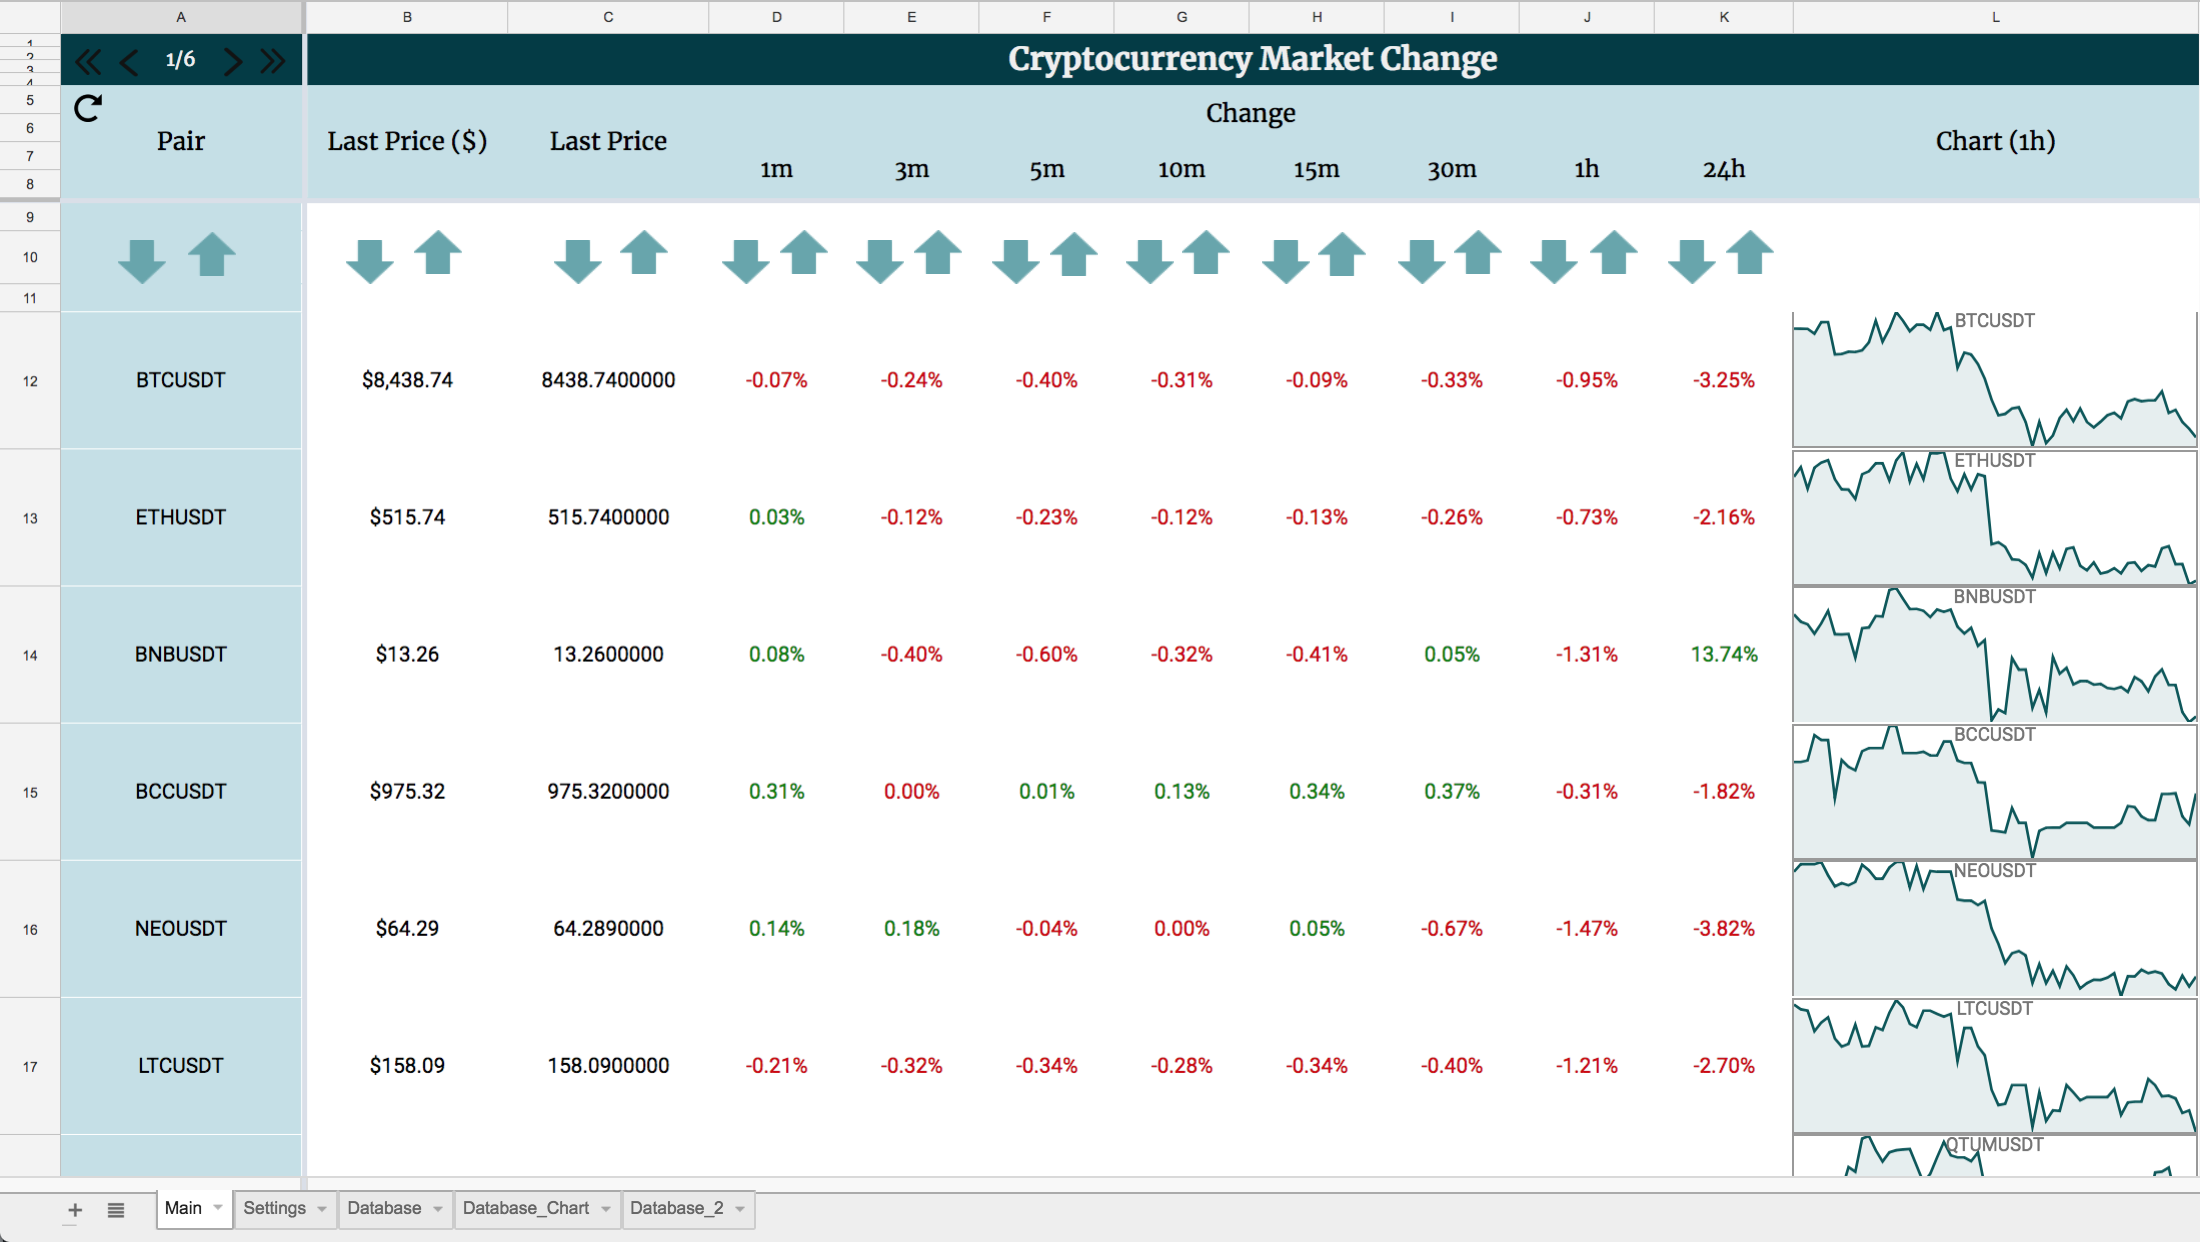
Using the API of Binance we get the prices of all cryptocurrency pairs (e.g. BTC/USD, ETH/USD, etc) every minute and for each pair we calculate the percentage change of the price for multiple time fractions. Additionally, a chart displaying the prices over the last hour corresponding to each pair is created.
All these are created using Google Sheets.
HOW
But how exactly does this work?
Actually, it’s pretty simple.
We just need to create a few Google Apps Scripts, which are based on Javascript.
First of all, a sheet is used to store the needed prices. Each row contains the prices of a pair and each column contains the prices for every minute in the last hour.
So, every minute the routine below is executed.
- Shift right the prices of the 59 columns.
// `first_column` contains the ``Now!`` price.
var first_column = 5;
var first_row = 3;
var ss_db = SpreadsheetApp.getActiveSpreadsheet().getSheetByName("Database");
var lastRow = ss_db.getLastRow();
var lastColumn = ss_db.getLastColumn();
//The next two lines shifts all the prices one cell to the right.
var price_get = ss_db.getRange(first_row, first_column, (lastRow - (first_row - 1)), (lastColumn - first_column)).getValues();
ss_db.getRange(first_row, (first_column + 1), (lastRow - (first_row - 1)), (lastColumn - first_column)).setValues(price_get);
- Gets the last price of each pair using the API
var url = "https://api.binance.com/api/v1/ticker/24hr";

var response = UrlFetchApp.fetch(url);
var text = response.getContentText();
var obj_array = JSON.parse(text);

var symbols = new Array();
var prices = new Array();
var prices_24h = new Array();

// From all the fetched data, keep only the symbol, the last price and the change of the price in the last 24h for each pair.
for (i=0; i<obj_array.length; i++) {

  symbols.push([obj_array[i]['symbol']]);
  prices.push([obj_array[i]['lastPrice']]);
  prices_24h.push([obj_array[i]['priceChangePercent']]);
}
- Store the prices in ‘Database’ sheet after we sort them by market.
ss_db.getRange(3, 1, symbols_sorted.length, symbols_sorted[0].length).setValues(symbols_sorted);
ss_db.getRange(3, 5, prices_sorted.length, prices_sorted[0].length).setValues(prices_sorted);
ss_db.getRange(3, 3, prices_24h_sorted.length, prices_24h_sorted[0].length).setValues(prices_24h_sorted_percentage);
WHAT DID I LEARN
Charts are heavy.
At first, I tried to display all the data (pairs) on a single sheet. That worked pretty fine. After that, I added the charts and that proved to be a mistake. The sheet became so heavy and slow that you couldn’t even scroll down without freezing repeatedly the whole webpage. The sheet was useless.
The solution that I implemented was to split the pairs into pages. As so, now, a single sheet contains much fewer, in my case up to 50, pairs per page and one can swap through pages with the click of a button.
Make it as light as possible.
The available computation power that is provided for each Google App, connected to a free Google account, is pretty limited, as you can see at the official Quotas for Google Services.
TIP #1
If you make url fetch calls, like connecting to an API as in our case, try and make as fewer calls as possible.
In our case, we make one call every minute. We get all the data that the API provides and then we keep only the values that we need, the name of the pair, the last price and the change of the price in the last 24 hours.
TIP #2
If you need to update repeatedly many cells in a sheet, use the getValues() and setValues() functions in order to get or set the prices on all cells at once.
For example, in order to copy 100 cells from column 1 to column 2
var ss = SpreadsheetApp.getActiveSpreadsheet().getSheetByName("Sheet1");

for (i=0; i<get_100_cells.length; i++)
  var cell_value = ss.getRange(i+1, 1).getValue();
  ss.getRange(i + 1, 2).setValue(cell_value);
}
Try replacing the for loop with
var get_100_cells = ss.getRange(1, 1, 100, 1).getValues();
ss.getRange(1, 2, 100, 1).setValues(get_100_cells);
The first implementation needs ~20 seconds to finish while the second one needs ~0.07 seconds…
The bad news is that this trick doesn’t exist on updating charts, only for updating cells. This is the reason why when moving to another page it takes so long to finish executing the script. However, one could prevent charts from automatically updating when a new page loads, by going to the “Settings” sheet and turning off the “Auto chart match” option. In this case, the carts can manually be updated by clicking on the refresh button on the top left corner of the “Main” sheet.
HOW TO USE IT
In order to fully use it, you will need to own a G-Suit Google account. You could use it with a free Google account too, however, it will stop updating the prices for a few hours per day because the script reaches the available computation time per day regarding the Quotas for Google Services.
In order make a copy for yourself, access the spreadsheet, then click “Sign In” on the upper right if you have not already signed in to your Google account and click “File” —> “Make a copy”.
Now let’s set it up to begin updating the prices from Binance.
- Close the shared spreadsheet and continue with the new copy that you just made.
- Go to the “Settings” sheet and click “On” on the first option ‘Auto price update’.
- A window will open asking you to authorize the script.
-
-
- Click “Review Permission”
- Choose your account
- Click “Advanced” on the warning that the app is not verified, that’s because I don’t own a developer account on Google.
- Click “Go to refresh_cell (unsafe)”
- Click “Allow”
-
That’s it!
Now the prices and the charts will be updated every one minute.
Note that it will take up to an hour after you activate it before all the ‘price change’ columns except the ‘24h’ column, gets updated.
Don’t bother yourself with all these sheets, all you need is the “Main” and “Settings” sheet.
Note
In case a chart return “NO DATA” instead of a graph, then go to settings tab and hit the “Reset” button. This happens because a new pair has been created by Binance and “Database” tab is updated with the prices of the new pair while the “Database_Chart” tab isn’t synchronized with it yet.
Sum up
Think of it as a small demonstration of the capabilities of Google Sheets after implementing a few custom scripts, and let your creativity flourish.