Recently I came across with a problem. How could one create a plot with given points in Google Sheets using Google Apps Scripts?
The first thought that came up was to use a Scatter type of chart to draw the points and then connect them. But I couldn’t find a way to connect the points with an App Script.
So I decided to use a Line type of chart.
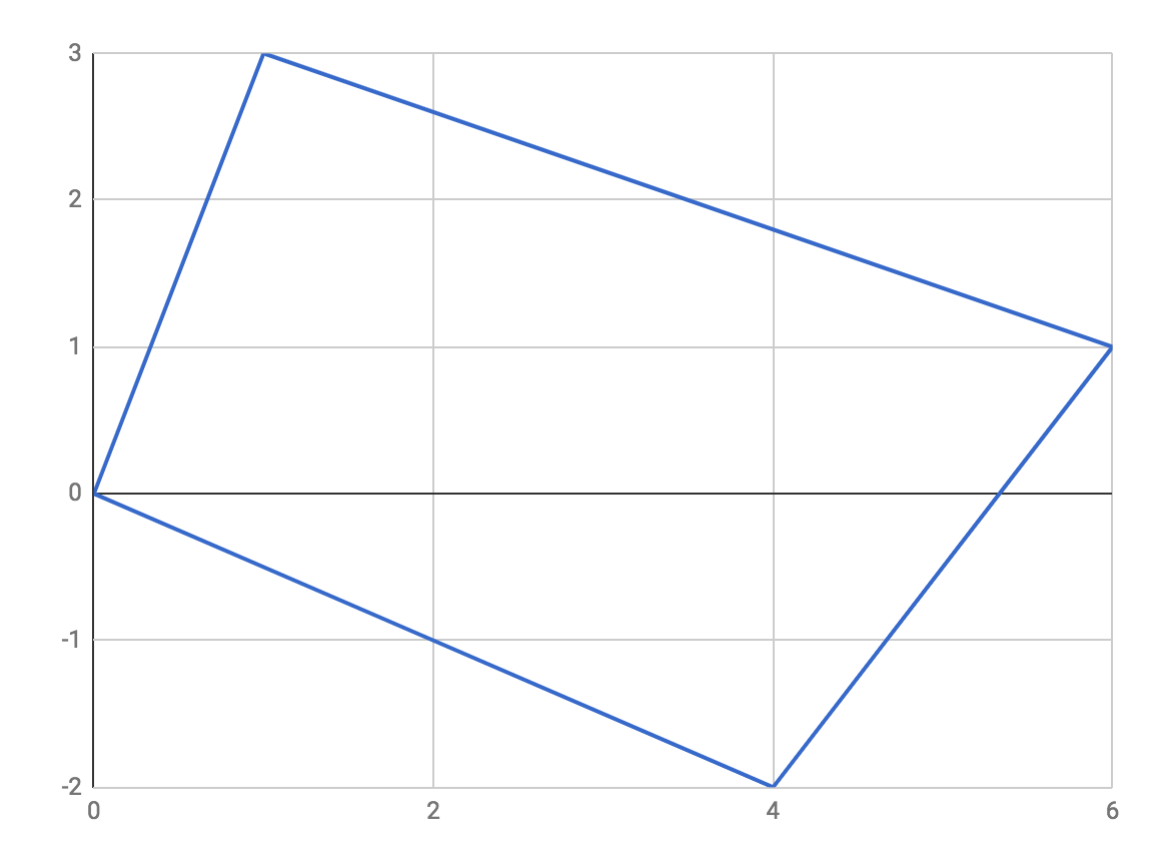
In order to create a closed shape and not a line, we need to provide the x-axis points into the ‘X-AXIS’ parameter and the y-axis points into the ‘SERIES’ parameter.
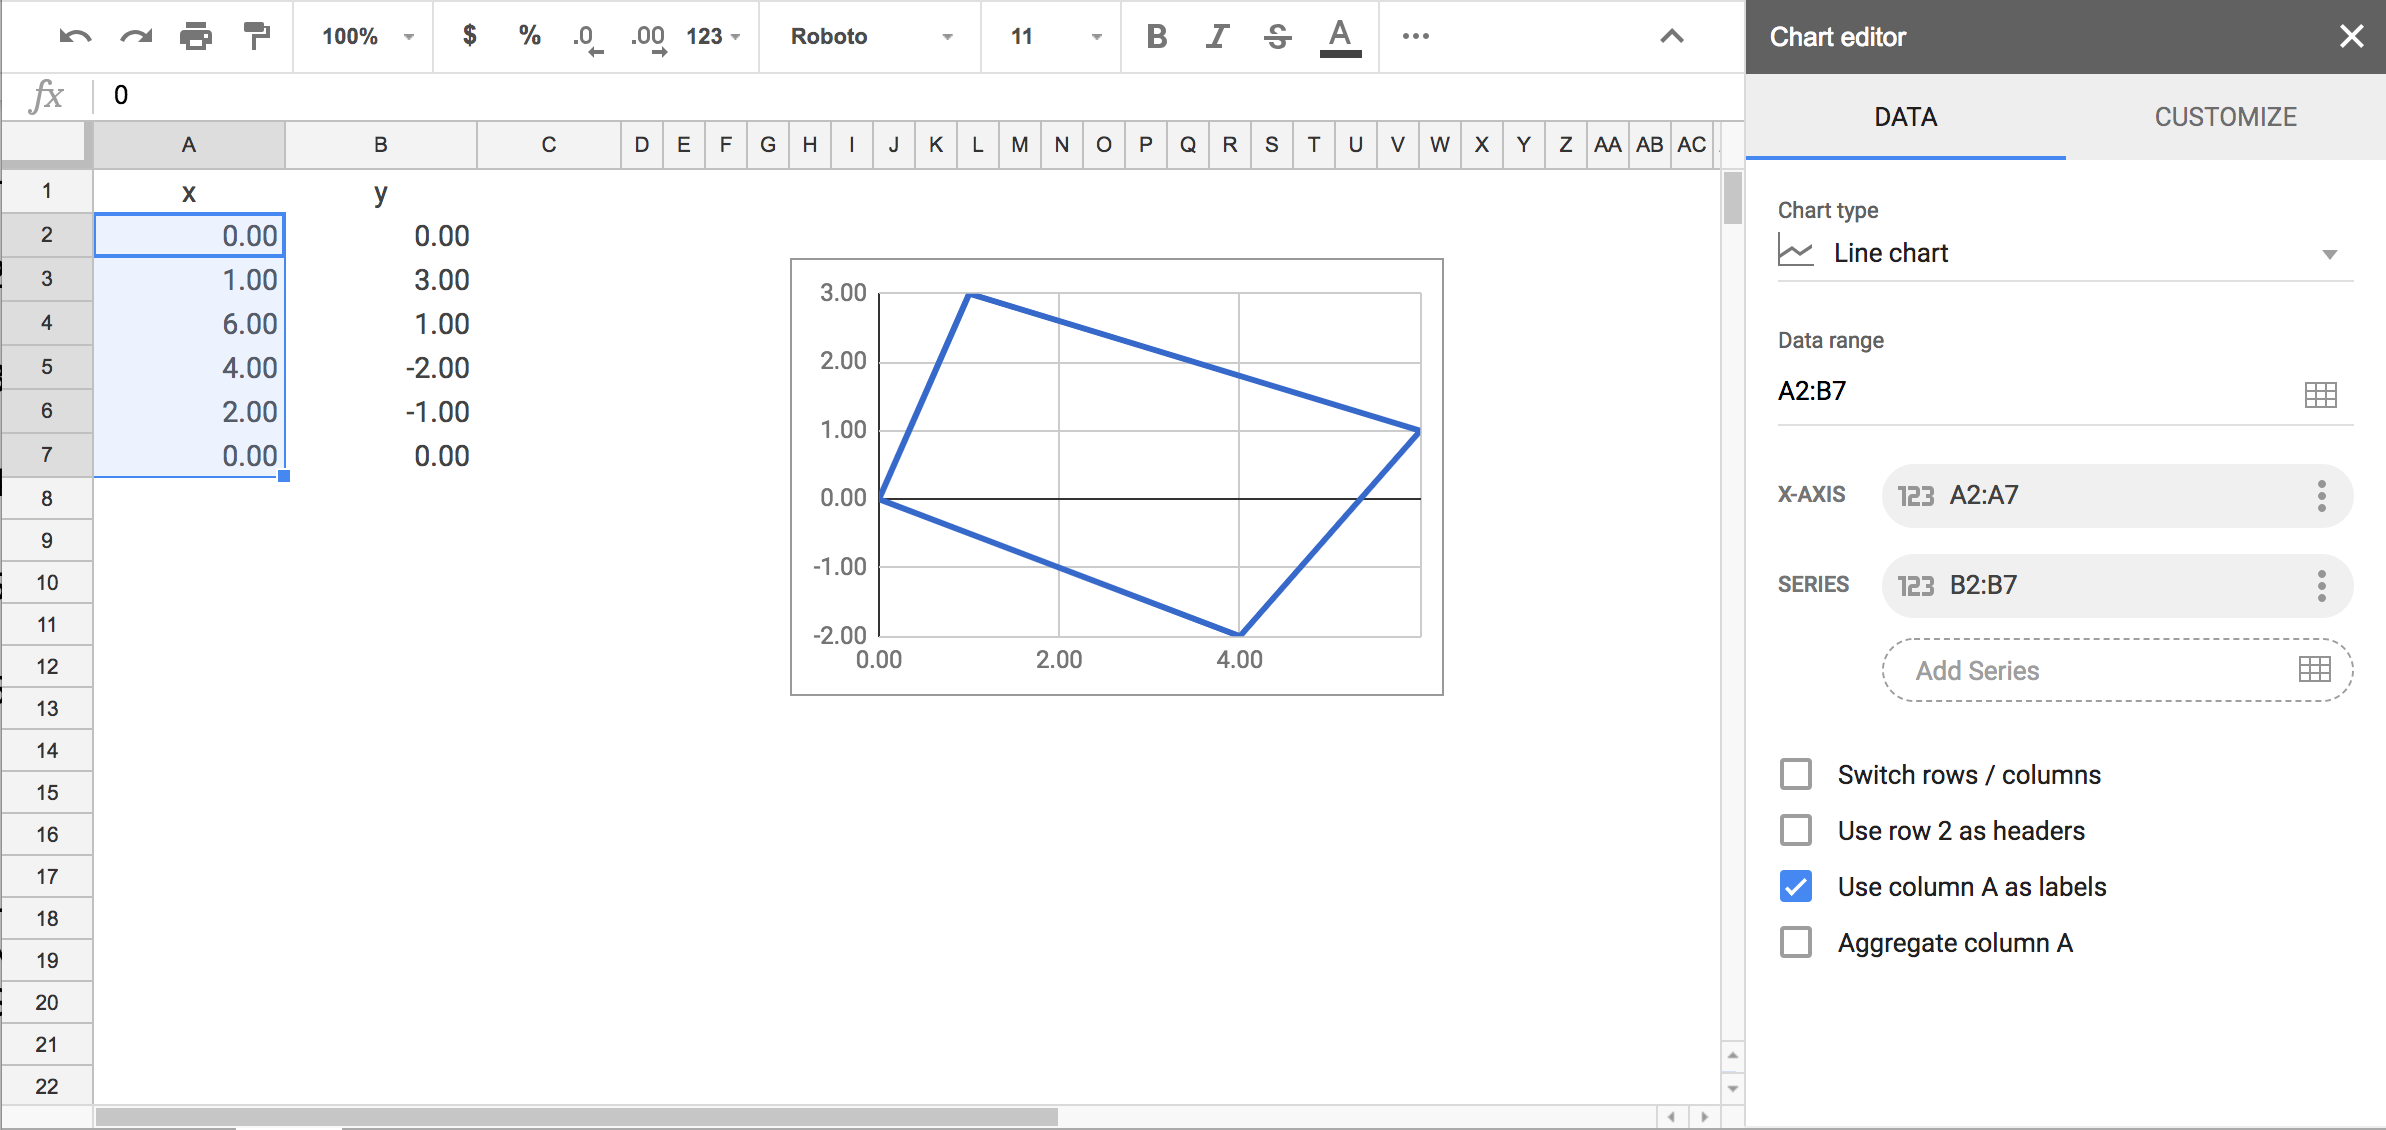
Else, if we provide both axis points in as a ‘SERIES’ or ‘Data range’ parameter it will create two separate lines.
So how could we set the ‘X-AXIS’ parameter using an Apps Script?
We can’t. At least not without a trick.
The only way to provide a chart with data is to set the ‘Data range’ parameter by
newChart().addRange()
and that’s what we will use here although it doesn’t solve our problem.
What will actually help us is the fact that Google Charts automatically sets a column of the ‘Data range’ as the ‘X-AXIS’ parameter when the cells are of type text.
But type text is not useful if we need to use the actual values of the x-points.
That’s why we will set the format of the cells as a Date instead.
I guess this is the easiest way to plot simple closed shapes in gSheets using a script.
Bellow is an example script.
function myFunction() {
  var ss = SpreadsheetApp.getActiveSpreadsheet().getSheets()[0];

  //Set the data cells.
  var xy_range = ss.getRange("A2:B7");
  var x_range = ss.getRange("A2:A7");

  // Add values to cells
  xy_range.setValues([[0, 0],
              [1, 3],
              [6, 1],
              [4, -2],
              [2, -1],
              [0, 0]
             ]);

  // Create chart
  var chart = ss.newChart();
  chart
  .setChartType(Charts.ChartType.LINE)
  .addRange(xy_range)
  .setPosition(2,8,0,0)
  .setOption('width', 400)
  .setOption('height', 300)

  var chart = chart.build();
  ss.insertChart(chart);

  // Set the x points as a date format.
  x_range.setNumberFormat("M/d/yy");
}